A project originally funded by the Royal Geographical Society (with IBG) with an Innovative Geography Teaching Grant to develop teaching ideas for using Google Earth in the Geography classroom, expanded to include ArcGIS Online in 2014
Wednesday, November 27, 2019
Tuesday, November 26, 2019
Google Earth Creative Tools - Part 2
I posted about the new Google Earth Creation Tools earlier in the week.
Three tutorial videos have been added to YouTube for those who want to take a look at how to make a tour before getting stuck in. Also here's another tip
These have been launched after extensive beta testing.New in Earth! Use our just-launched creation tools to share your stories and maps using #GoogleEarth. Here's how it works: https://t.co/fqVXP8A4Ln pic.twitter.com/SQKBjQWuyO— Google Earth (@googleearth) November 20, 2019
Three tutorial videos have been added to YouTube for those who want to take a look at how to make a tour before getting stuck in. Also here's another tip
Did you know that you can embed info into a place using the new @googleearth creation tools ?— ѕteve sмιтн 🌍🇳🇿 (@crispy_smith) November 26, 2019
Here's how to add an interactive 360 image to a Pin https://t.co/qioCCP8put #GE3 #syd19 #GoogleEI @googledownunder embed codes for the win ! @EarthOutreach
Wednesday, November 20, 2019
Google Earth Creative Tools
For some months now, thanks to an invite from Richard Allaway, I've been part of a group of beta testers for some new creative tools on Google Earth on Chrome.
The announcement is here.
Today is launch day and we have been given the news to share that these tools exist, and also some stories that we may have been working on.
Google wants Earth to become a “storytelling canvas” that lets you “create a map or story about the places that matter to you.” These creation tools are accessed by clicking the new “Projects” tab in the sidebar and creating one.
After adding a location by search or dragging a pin, you can attach images, text, videos, and customize other properties, including colors, pins, and choosing the right 3D view to frame. In addition to places, you can draw lines, shapes, and Street View.
All work is saved to Google Drive and supports standard collaboration. Once complete, there is a “Present” view that flies you from location-to-location while displaying all your notes on top. In addition to the web, the final project is available on mobile and tablet devices with the Google Earth app for Android or iOS.
I have started to produce a story on South Georgia for my first attempt, as part of a resource that I am producing for the South Georgia Heritage Trust. This has been blogged about elsewhere.
Here's the link to the story so far.
The tools produce a similar outcome to that produced with ESRI StoryMaps, but with variations in imagery and functionality of course. The two tools aren't necessarily in competition and it remains to you to consider.
Check Richard Allaway's examples here: revising extreme environments.
Wednesday, October 23, 2019
Saturday, October 12, 2019
Digimap v2
Having an early play with this today.
A new, improved version 2 of the GA Gold Award winning Digimap for Schools.
Information from Edina.
Digimap for Schools - the definitive global digital atlas for schools
The Digimap for Schools Team are pleased to announce the imminent arrival of a new version of their award winning schools service.
This new version has all the mapping products and functionality Digimap for School users are already familiar with (Ordnance Survey mapping, historical data and aerial photography for GB, drawing tools, image library, webinar and training support), but adds:
Global mapping
- incorporation of the beautiful and authoritative Collins Bartholomew World Panorama product providing a definitive global school atlas
- the same wonderful Ordnance Survey data for Great Britain and beyond GB for the rest of the world, detailed street level mapping from Open Street Map:
An updated and modern intuitive User Interface has been added - this is similar to the one on the DataNation website which is an optional upgrade for schools who don't already have Digimap for Schools perhaps. It also includes a useful additional option to find your location and zoom to it, rather than using the search, or drawing a rectangle as currently.
The new version of Digimap for Schools will be available from November 2019 at http://digimapforschools.edina.ac.uk
Access to the old version will remain available from the same address.
The existing Digimap for Schools version will remain supported until January 2021.
Schools resubscribing to Digimap for Schools before March 2020 will be able to chose between the old version and our new enhanced Global version.
From March 2020 subscribers will only be able to take our new enhanced service.
(Re)subscription will be on a rolling twelve month basis as is the case now. It will not be possible to subscribe to both new and old versions.
As always, the Digimap for Schools Team are happy to respond to any questions or concerns you may have over on the website.
Labels:
Atlas,
DataNation,
Digimap for Schools,
EDINA,
Mapping
Monday, September 09, 2019
Humber 2100 StoryMap
Thanks for the tipoff from Bob Lang to this ESRI StoryMap
Useful for all sorts of rivers / flooding / landscape management related topics...The Humber estuary has some of the highest flood risk in the country and is vulnerable to rising seas - hence our work on a new strategy to 2100. Check out our interactive storyboard for everything on the Humber past, present and future https://t.co/1CYPCh5BjU #geographyteacher pic.twitter.com/17tkUUSZIL— John Curtin (@johncurtinEA) September 9, 2019
Labels:
Environment Agency,
ESRI StoryMaps,
Flooding,
Humber,
StoryMap
Friday, August 02, 2019
GA Presidents Blog
I have spent much of the last four days researching the 1920s and the history of the Geographical Association for the next phase in my major project around my GA Presidency: the creation of a biography of all the presidents since 1893, and associated events. I've also been contacting lots of former Presidents and finding out a whole range of stories and connections to
Check out the project here. You can also subscribe to the blog.
I'm currently in 1927, and the most recent President to be added was Charles Close, who was Director General of the Ordnance Survey - hence the map link.
Check out the project here. You can also subscribe to the blog.
I'm currently in 1927, and the most recent President to be added was Charles Close, who was Director General of the Ordnance Survey - hence the map link.
Thursday, July 11, 2019
ESRI New Community Analyst
A guide by Katie Hall can be seen here
Labels:
Community Analyst,
ESRI,
ESRI UK,
Geodemographics,
Infographics,
Katie Hall
Sunday, June 30, 2019
Name your own city
Dan Cookson has started a new geographical map project which allows users to define their own cities using Maptionnaire and Carto.
Will be fascinating to see which cities transform themselves and how quickly.— Dan Cookson (@danc00ks0n) June 23, 2019
Had some fun with City status here https://t.co/6rGrvHLuV7
Sunday, June 16, 2019
Fieldwork Data plotted
Lovely work by Brendan Conway
Follow the thread and replies for more guidance.
Cross-sectional area plotted w ArcGIS Online Scene + OS Map 3D: River Carding Mill Valley, #ShropshireHills #Bradshaw #GCSE CA @GIS4Schools pic.twitter.com/jwhfkxUeHv— BC (@mildthing99) December 16, 2016
Labels:
3D Scenes,
ArcGIS Online,
Fieldwork Data,
GIS
Thursday, June 13, 2019
Where have you BEEN?
Thanks to Miss McEvoy on Twitter for this tipoff.
Been is an app produced by a Swedish organisation.
It has a simple interface. Check the box next to each country's name and you can record where you've BEEN, and what percentage you've covered... Here's my fairly limited wanderings - plenty in Europe, but not much beyond... The video can be uploaded to Instagram and exported in other formats.
Friday, May 31, 2019
OS Interactive Mapping used to collect Poems about Places
The Places of Poetry website has launched today.
I mentioned it earlier in the year when I first heard about it.
It is collecting poems which are written about places, which can then be pinned to an interactive map. Click the menu icon top right on the home page for all the details and to add your own poem.
Read about the project on the OS blog here. There is a link with the Ordnance Survey.
The project has been developed by Paul Farley and Professor Andrew McRae, who says:
“Poetry has been used across the centuries to reflect on places and their histories. We’re using modern technology to reinvigorate this model, and we hope that as many people as possible get involved. We are excited to see where people pin their poems, and what they say about the places that matter to them.”
I went on this morning and added my own poem to the map.
You can view and read it here, just outside of the city of Ely.
My poem also has a link to the Ordnance Survey, as it describes the survey of the Fens that was done in 1916, and imagines the challenges facing the surveyors of capturing this fluid and flat landscape with its shifting rivers and streams, only to find that an old Fenland boy spots a mistake. Fast-forward 100 years, and students on a geography fieldtrip, using their smartphones, notice a missing stream on their digital maps...
Why not write / add your own poem to the map to contribute.
The map is open for contributions until October, and I look forward to seeing more poems appearing over the next few months.
Here's the poem for those who might like to read it and haven't already...
Six Inches to the Fenland Mile by GeoBlogs on Scribd
Labels:
Mapping,
Ordnance Survey,
Places of Poetry,
Poetry
Monday, May 27, 2019
Plotting a route on OS Maps
Another one for National Map Reading Week.
Labels:
Apps,
Map Reading,
Ordnance Survey,
OS,
Routes
National Map Reading Week
It's a pity that it's during the school holidays as we normally do a big push on this at school, and it's sometimes been later in the year.
It's National Map Reading Week, so try to get out there this week with an OS Map and try the downloadable guides.
Perhaps this is the week to do a trial of the OS Maps app - it's excellent...
It's National Map Reading Week, so try to get out there this week with an OS Map and try the downloadable guides.
Perhaps this is the week to do a trial of the OS Maps app - it's excellent...
Tuesday, January 22, 2019
Google Earth Studio
I was invited to Google Earth Studio a few weeks ago, but just had a moment to take a look.
You need to request an invite and wait to be approved. This can take a while.
You will be able to access the STUDIO area - using Chrome.
Not sure what it can do? Watch this showreel...
I'm going to have a go at making some when I get a moment.
There is a series of Tutorial videos available in the Tutorials area.
Follow the links down the left hand side for all the relevant information.
I started with the Basics video - narrated by John Bailey I think... This introduces you to the basics of producing an animation: there are two areas to the screen, and you can animate sections to produce a completed video.
The second video explores easing animations, including curving paths and other effects to make your animations nice and smooth.
The final video explores Multi-camera views
Friday, January 18, 2019
GIS in Schools
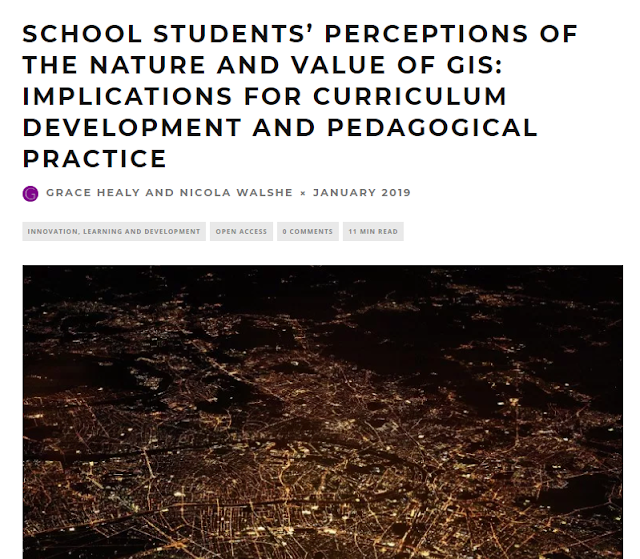
Grace Healy has a piece in the latest issue of IMPACT: the journal of the Chartered College of Teaching.
The majority of each issue can be read online, which for me negated some of the benefits of membership, as the journal was one of the few tangible 'benefits' of membership.
This issue is on the theme of Ed-tech: education technology.
Grace's piece, written with Nicola Walshe, is on the use of GIS.
Nicola has previously done quite a lot of work on GIS, and I've been to speak to Homerton students when she was the tutor there, about my use of technology in the classroom.
Read the GIS piece here, or follow the earlier link to access all the open access pieces from this issue. There's a piece by David Rogers on the cloud and CPD, and one by the wonderful Steve Bunce too, but you'll need to be a member to read those...
Subscribe to:
Posts (Atom)